See what's really happening in any suburb
Antown App turns Australian property data — recent sale prices, how values have changed between sales, and the agents behind the results — into clear, interactive maps and tables. Search any address and see the full picture in seconds.
Clear, visual insights
Recent sale prices, value changes and agent results rendered as maps and tables you can read in seconds.
Built on real listings
Sourced live from realestate.com.au and domain.com.au, refreshed regularly.
Free to explore
Search a featured address and start exploring the local market right away.
See how much a home's value has really moved
Search an address and explore every nearby property that has been resold — its previous and latest sale price, the percentage change, and how long it was held — on an interactive map and a sortable table.
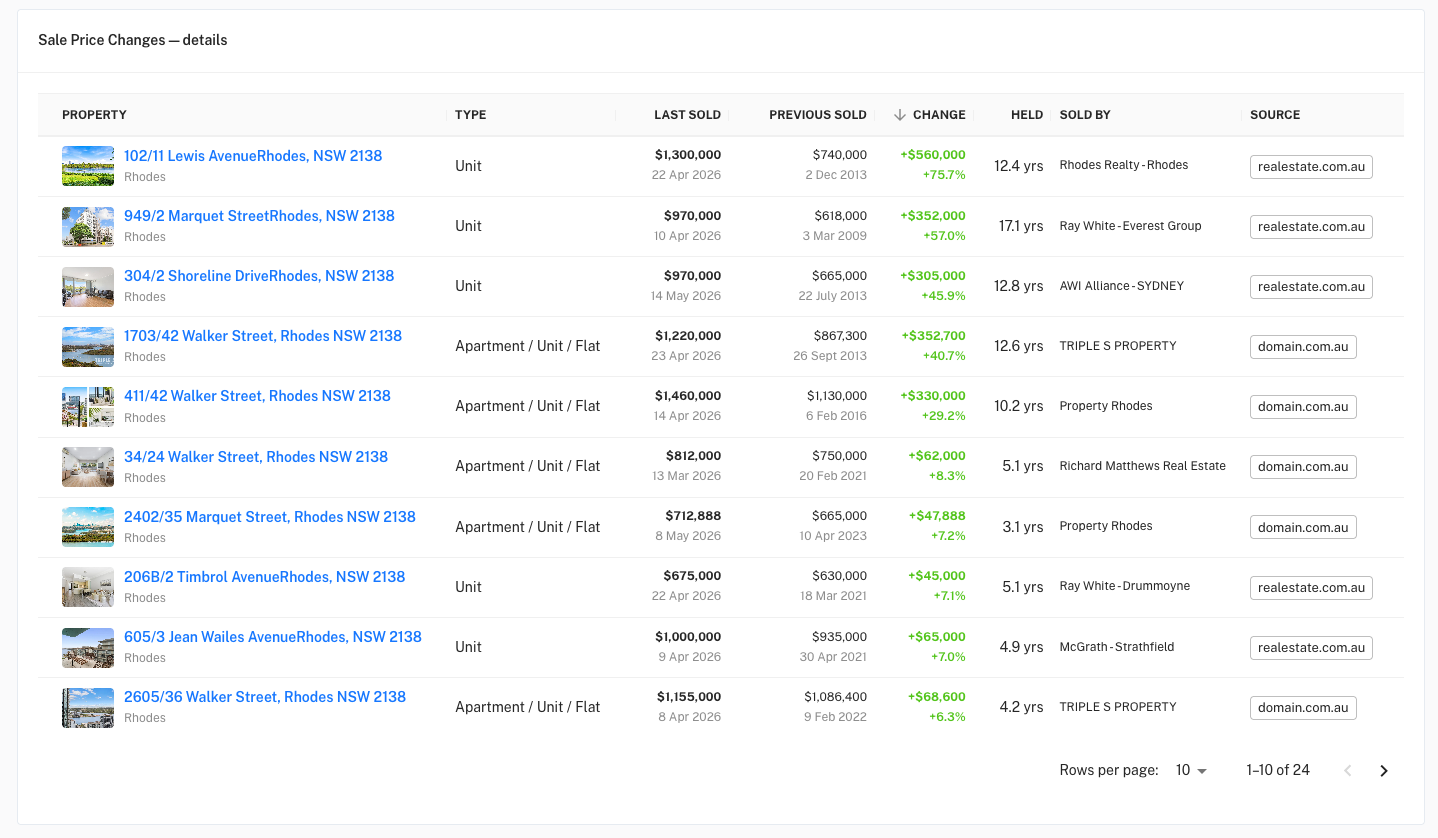
Every resale, compared to its last sale
A clean, sortable table of the properties around your address that have changed hands more than once — last sold price, previous sold price, the dollar and percentage change, hold period and the agency behind the sale. Green for value gained, red for value lost, so the trend is obvious at a glance.
Find the agents and agencies that actually deliver
See which agencies and agents are getting the best results around any address — backed by the real resale numbers, not just a headline. The high-level view of what is really happening on the ground.
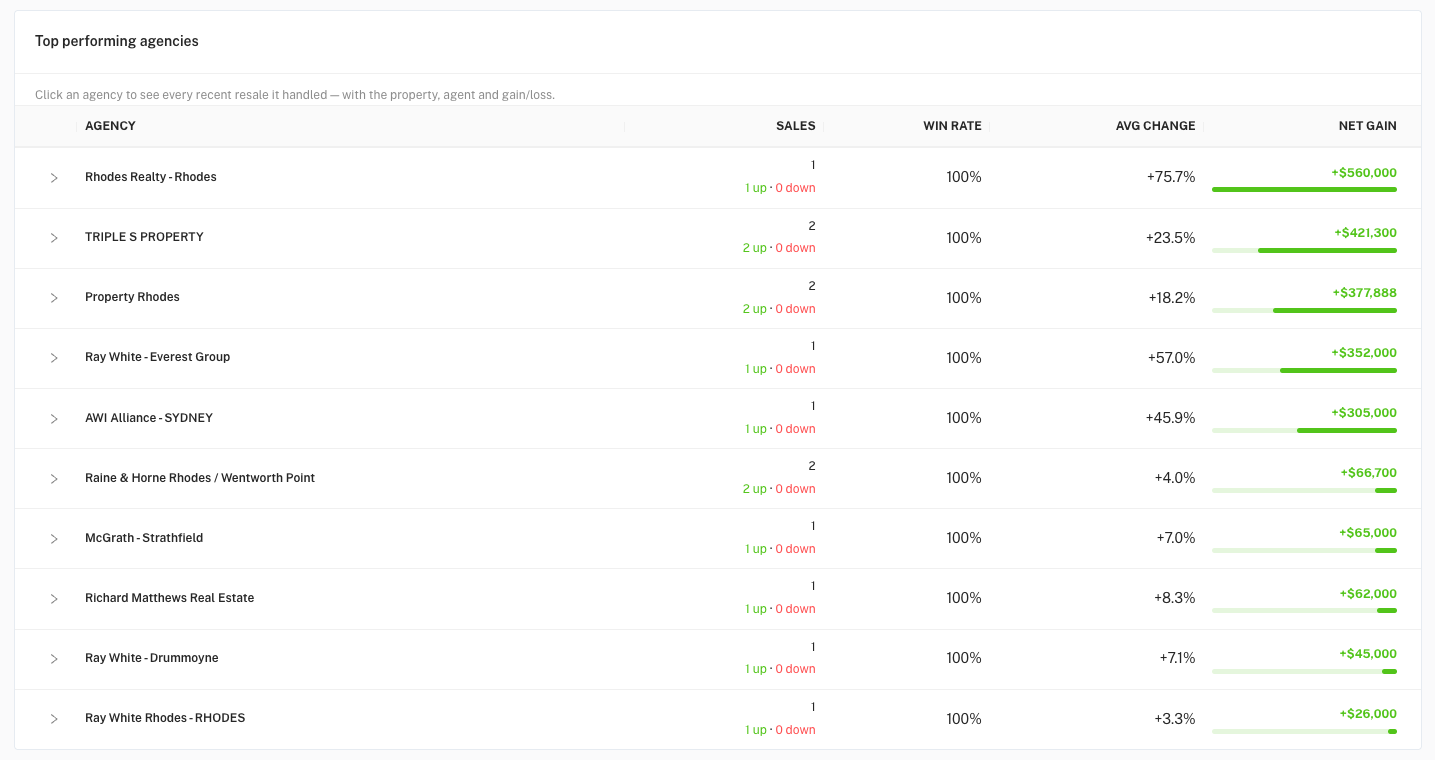
Rank every agency by the results they deliver
A leaderboard of every agency active around an address — ranked by sales, win rate, average price change and net gain. The clear green bars make the standouts obvious at a glance.
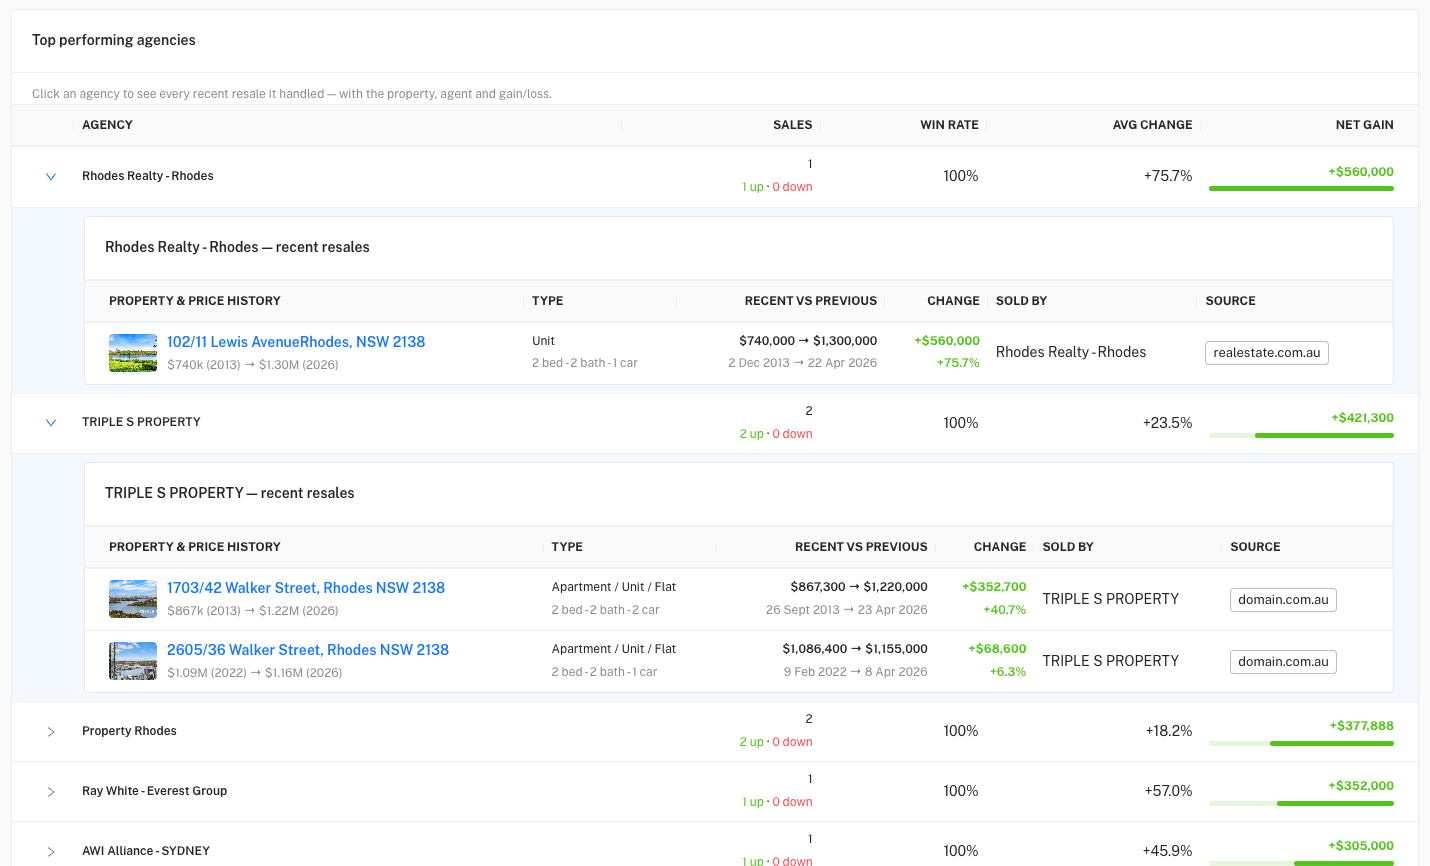
See exactly how each result was won
Expand any agency to see every recent resale it handled — the property, its full price history, who sold it and the gain or loss — so a strong track record is backed by the actual numbers.
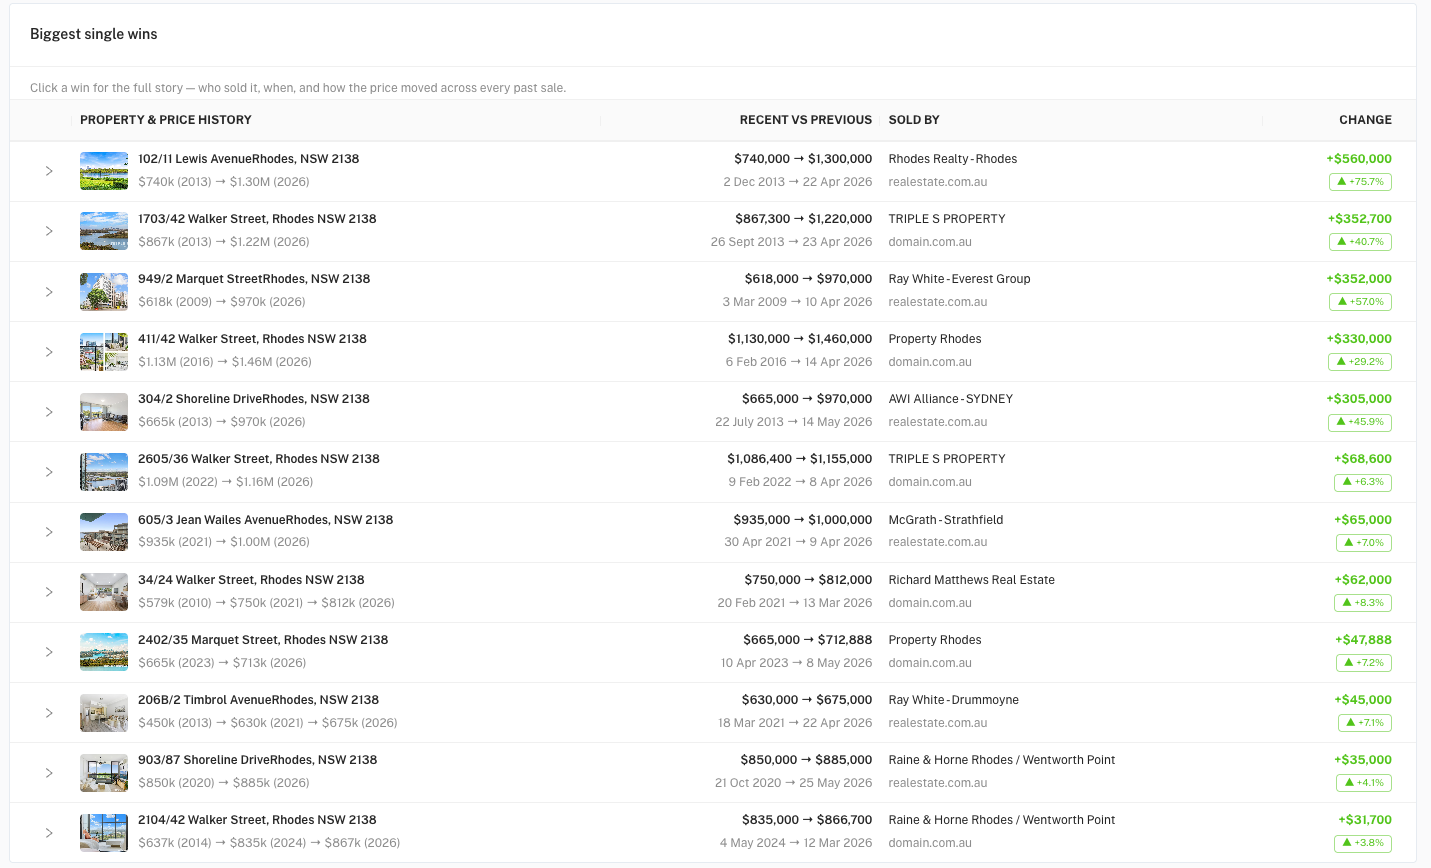
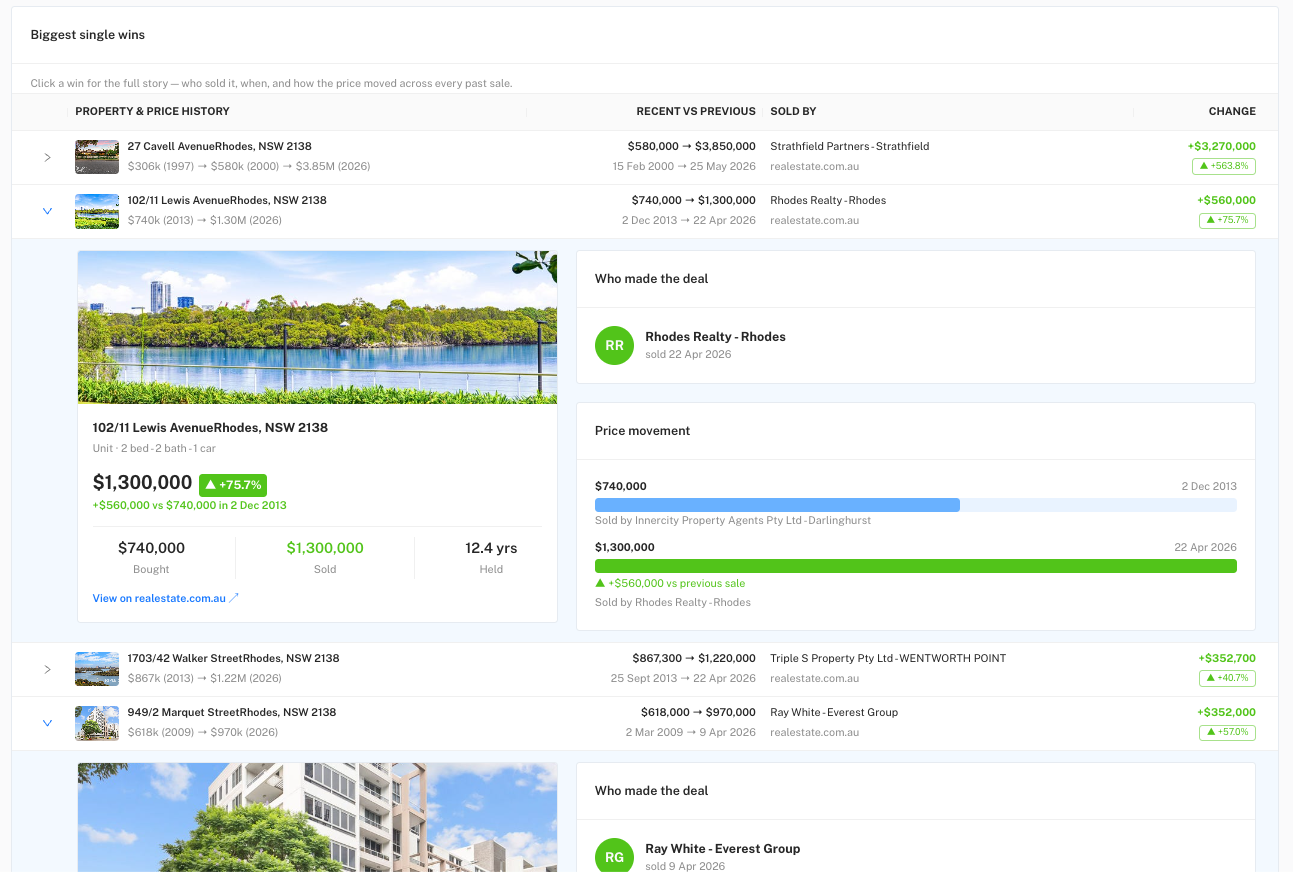
Spot the standout results
The individual properties with the largest gains, surfaced in one place — the full price history, the agent behind each sale, and how much value was added between the last two sales.
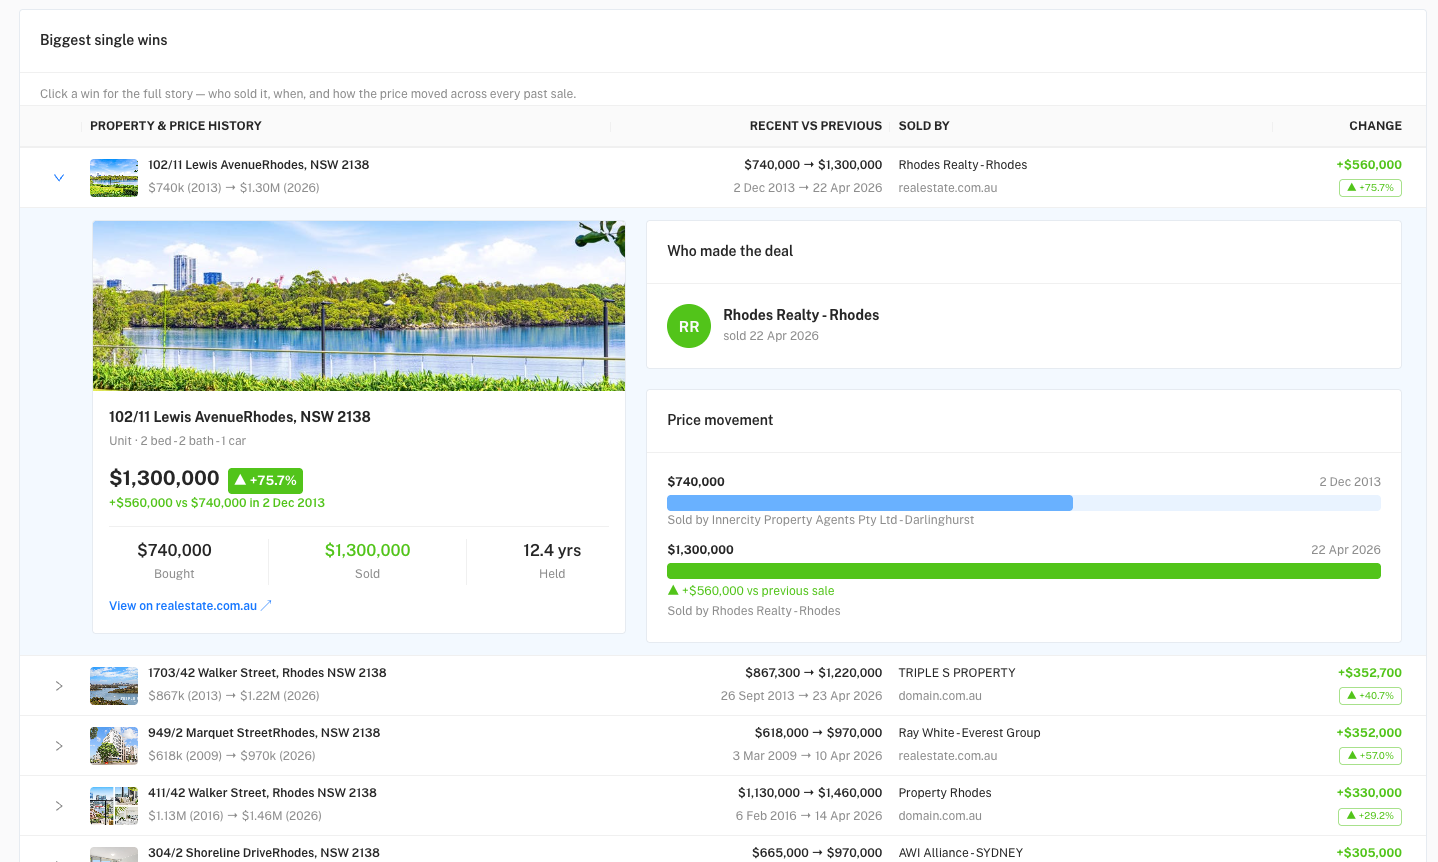
Open any win to see the whole picture
Click into a result to reveal its price-movement chart across every recorded sale, who made the deal, and the bought, sold and held-for figures — the complete story behind the headline gain.
Ready to explore your local market?
Start exploring sale price changes and agent performance today — it is free to get started.
Or create a free account to save your searches.
Antown App
Clear, visual Australian property insights for buyers, sellers, renters and agents.
Company
© 2026 Antown App. Data sourced from realestate.com.au and domain.com.au. For informational purposes only — not financial or property advice.